How to Calculate Cumulative Percentage: Ultimate Guide to Pareto Charts & the 80/20 Rule
Imagine discovering that 80% of your business's profits stem from just 20% of your products. Or that a handful of recurring customer complaints account for the lion's share of your support tickets. This isn't wishful thinking—it's the Pareto Principle in action, a timeless insight named after economist Vilfredo Pareto, who observed in the late 19th century that 80% of Italy's land was owned by 20% of the population. Fast-forward to today, and this 80/20 rule powers everything from quality control to sales strategies. But how do you uncover these hidden patterns in your data? Enter cumulative percentage explained through Pareto charts—the visual powerhouse that turns raw numbers into actionable revelations.
In this ultimate guide, we'll demystify how to calculate cumulative percentage, master the Pareto chart cumulative percentage, and apply the cumulative percentage formula with real-world precision. Whether you're a business owner streamlining operations, a quality manager hunting defects, a data analyst chasing insights, or a student tackling stats homework, you'll walk away with the tools for those game-changing 'aha' moments.
What Is Cumulative Percentage? A Crystal-Clear Breakdown
At its core, cumulative percentage is a running total of percentages, added up sequentially to show how much of the whole is captured as you move through a dataset. Think of it as a progressive tally: start with individual percentages of a total, sort them (usually descending), and keep a rolling sum. This builds a staircase of insight, revealing where the bulk of your data concentrates.
Why does this matter? In isolation, percentages tell part of the story. Cumulatively, they spotlight imbalances—like how 20% of causes drive 80% of effects. It's the math behind prioritization, efficiency, and those rare 'eureka' decisions that transform chaos into clarity.
How to Calculate Cumulative Percentage: Step-by-Step Formula Guide
The Cumulative Percentage Formula Explained
Mastering how to calculate cumulative percentage boils down to three straightforward steps. Let's use a simple dataset: suppose you have sales figures for five products totaling $100,000.
- Calculate individual percentages: Divide each item's value by the grand total, then multiply by 100. Formula:
(Item / Total) * 100. - Sort descending: Arrange from largest to smallest to mimic Pareto logic—biggest impacts first.
- Build the running total: Add each percentage to the prior cumulative sum. Formula for the nth item:
Cumulative % = Previous Cumulative % + Current %.
Here's a quick table example:
| Product | Sales ($) | % of Total | Cumulative % |
|---|---|---|---|
| A | 50,000 | 50% | 50% |
| B | 20,000 | 20% | 70% |
| C | 15,000 | 15% | 85% |
| D | 10,000 | 10% | 95% |
| E | 5,000 | 5% | 100% |
Boom—85% of sales from the top three. That's your cumulative percentage formula at work, step-by-step.
The Pareto Principle: Why Pareto Charts Rely on Cumulative Percentage
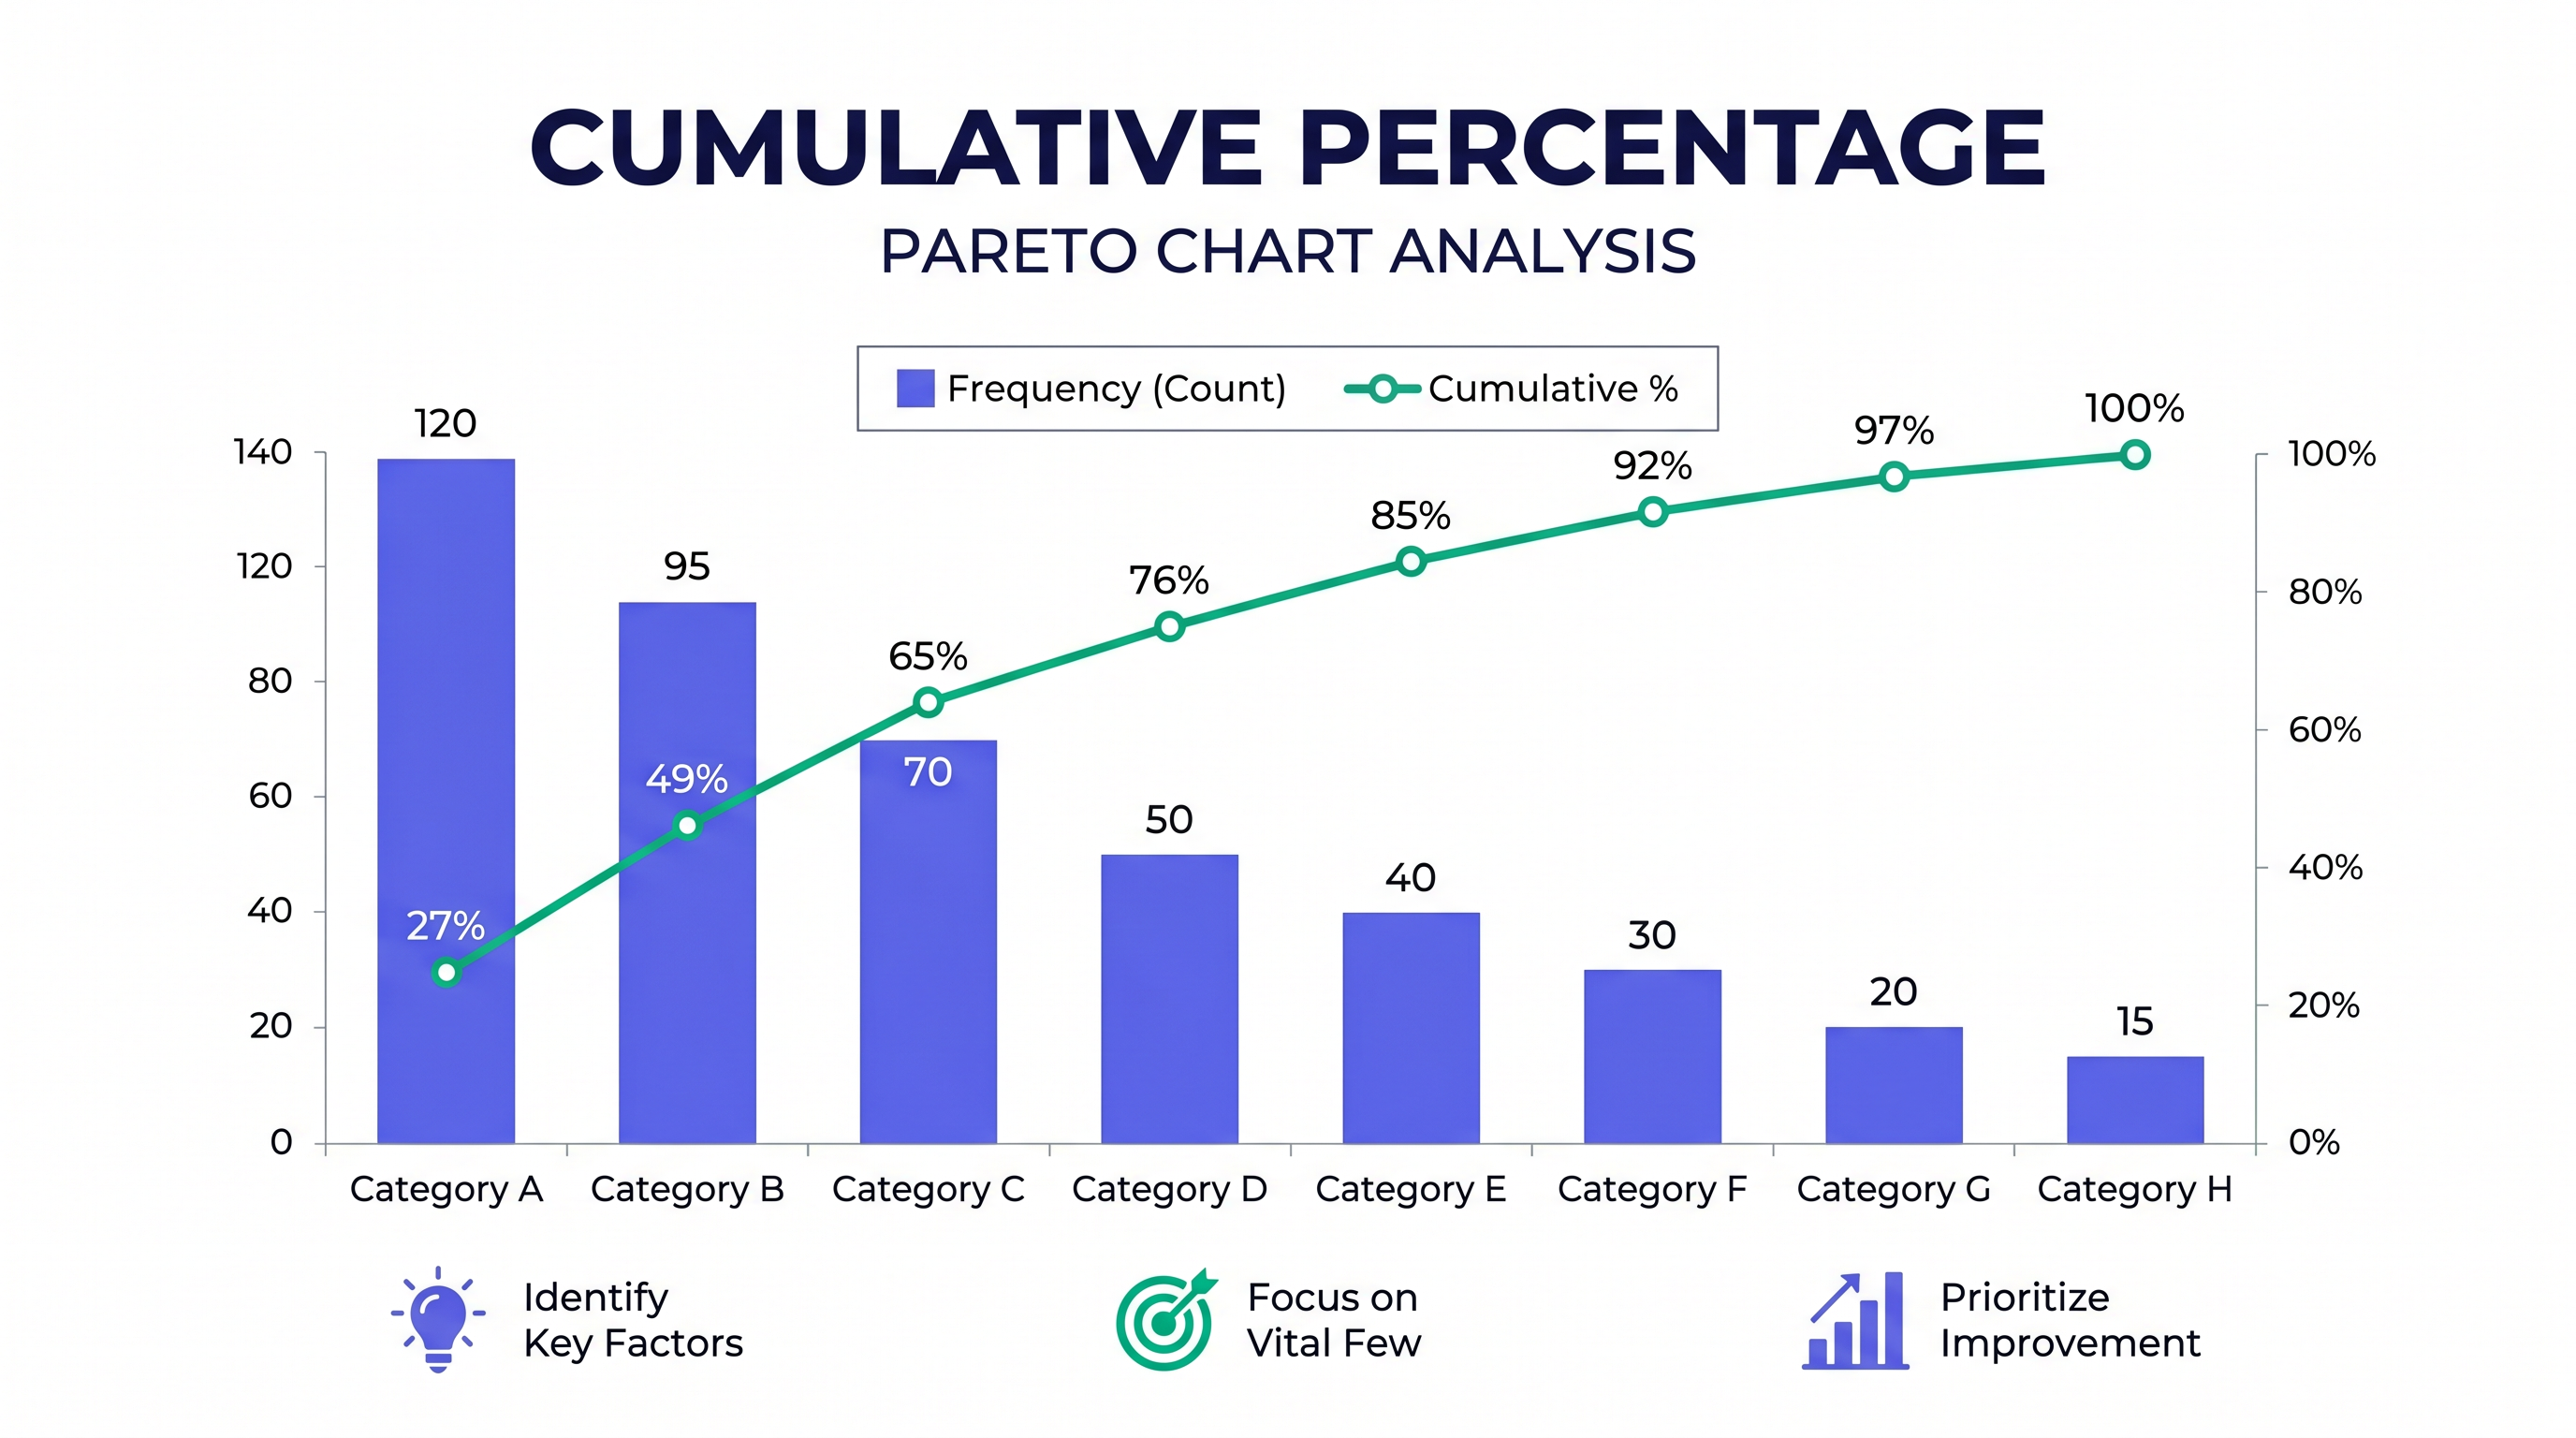
Vilfredo Pareto didn't stop at land ownership; his principle echoes across domains. In quality management, Joseph Juran adapted it: 80% of problems from 20% of causes. A Pareto chart cumulative percentage visualizes this—a bar graph of sorted categories beside a rising line of cumulative percentages. The 'knee' where the curve steepens signals your vital few versus trivial many.
Picture a factory floor buried in defects. Without Pareto, you're firefighting everywhere. With it? Laser-focus on the 20% causing 80% downtime. It's not magic; it's math meeting reality.
Real-World Examples: Pareto in Action
Customer Complaints in a Retail Business
A business owner tracks 500 complaints: delayed shipping (200), poor packaging (150), wrong items (80), etc. Percentages: 40%, 30%, 16%... Sorted cumulative: 40%, 70%, 86%. Fix shipping and packaging—poof, 70% resolved. That's the 'aha' of Pareto chart cumulative percentage.
Product Sales Optimization
Sales data for 10 SKUs totals $500K. Top three: 60K (40% cumulative 40%), 30K (24% → 64%), 20K (16% → 80%). Stock the stars, prune the rest. Revenue surges without extra effort.
Bug Tracking for Software Teams
Data analysts log 1,000 bugs. UI glitches (400), crashes (250), performance (150)... Cumulative hits 80% by the third category. Devs prioritize: release velocity skyrockets.
Excel Mastery: Implementing Cumulative Percentage with Formulas
Excel turns theory into triumph. Assume Column A: categories; B: values; C: total (use =SUM(B:B)); D: % (=B2/$C$1—mixed reference locks total); E: Cumulative (=SUM($D$2:D2)).
- Sort B descending (Data > Sort).
- Drag formulas down. Watch the line climb.
- Insert combo chart: bars for values, line for cumulative % (secondary axis).
Pro tip: Format the line in indigo (#6366f1) for that professional pop, bars in emerald (#10b981). Instant Pareto chart. For quick calcs, try our free tool at the homepage calculator.
Interpreting Pareto Curves: Spotting the 80/20 Knee
The curve starts steep, flattens. Cross 80%? That's your cutoff. But watch for outliers—sometimes it's 70/30 or 90/10. Context is king: in volatile markets, the knee shifts. Always validate with domain knowledge for true authority.
Beyond Business: Cumulative Percentage Everywhere
Economics: 80% wealth in 20% hands. Education: Top 20% scores drive class averages. Even biology—Pareto in species distribution. Students, apply it to exam data: focus study on high-yield topics. Universally potent.
Cumulative percentage isn't just a formula; it's a lens for seeing the world unevenly—and winning because of it.
Wrap-Up: Your Pareto Power-Up
From raw data to razor-sharp decisions, you've got the cumulative percentage explained, formulas, charts, and examples. Dive into Excel, build your first Pareto, and watch inefficiencies evaporate. Need instant step-by-step formulas? Hit the homepage calculator. The 80/20 world awaits—prioritize boldly.