How to Calculate Percentage in Excel: Ultimate Formulas for Change, Increase, Total & More
Why Mastering Percentages in Excel Changes Everything
Picture this: You're a retail manager staring at last month's sales figures, heart sinking as numbers blur into a foggy mess. Or maybe you're a student juggling grades, wondering if that extra credit will tip the scales. Finance pros crunching budgets, business owners eyeing profit margins—whatever your world, percentages are the universal language of progress and precision. Yet, in Excel, they trip up even seasoned users. What if one simple percentage formula Excel could unlock clarity? Enter the ultimate guide to how to calculate percentage in Excel. We'll demystify formulas for totals, changes, increases, and beyond, with step-by-step walkthroughs, real-world scenarios, and pro tips. By the end, you'll wield Excel like a PercentPro wizard.
The Foundational Percentage Formula in Excel
At its core, calculating a percentage in Excel boils down to division dressed in a percent costume. The magic incantation? = (Part / Whole) * 100. But Excel streamlines it: just divide the part by the whole, then format as percentage. No *100 needed—Excel handles the multiplication behind the scenes.
Step-by-Step: Your First Percentage Calculation
- Click an empty cell.
- Type
=A2/B2(assuming part in A2, whole in B2). - Press Enter.
- Right-click the cell > Format Cells > Percentage. Boom—your result shines as 25%.
Real-world spark: A business owner tracks expenses. Cell A2: $150 spent on marketing. B2: $600 total budget. Formula yields 25%—instant insight into overspend risks. Students, swap for quiz scores: 18/20 = 90%. This bedrock percentage formula Excel powers everything ahead.
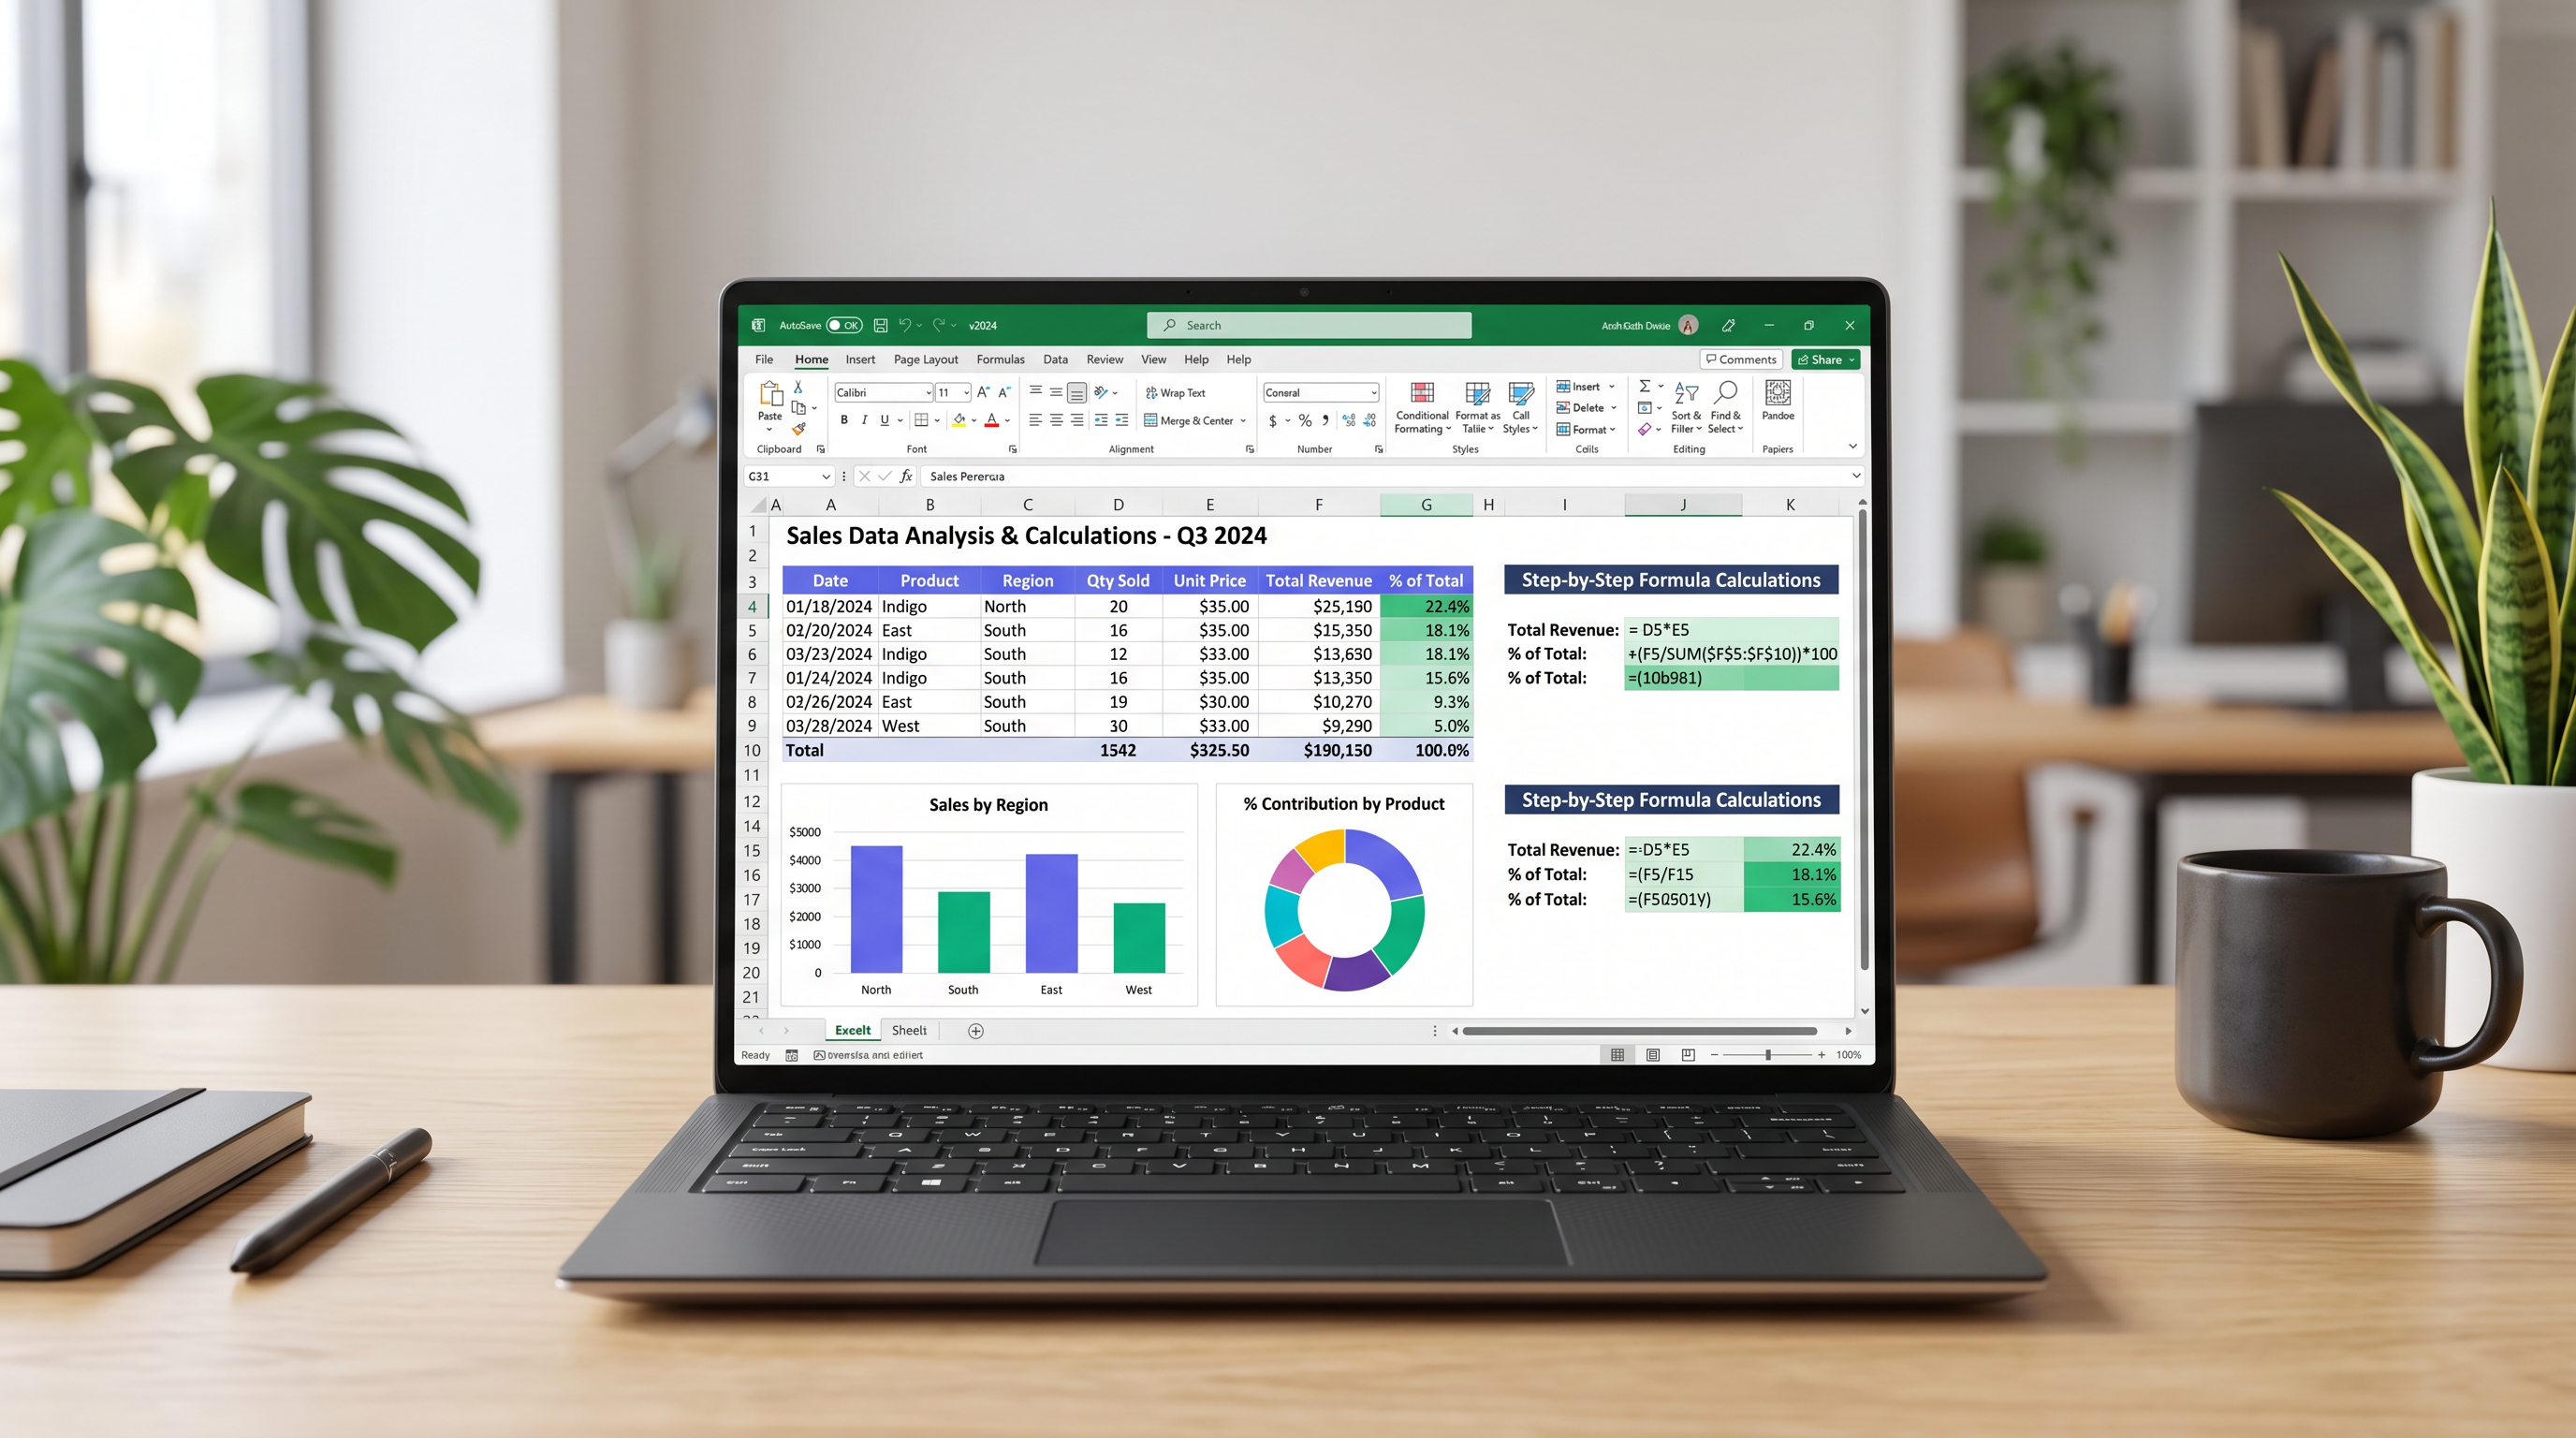
Excel Percentage of Total Formula: Slicing Data Like a Pro
Budgets beg for it. Sales reports crave it. The Excel percentage of total formula reveals slices of the pie. Imagine a monthly budget: Rent $1,200, Groceries $400, Entertainment $200. Total? $1,800. What's groceries' share?
Formula Breakdown
In a table (A1: Category, B1: Amount):
- B5:
=B2/SUM($B$2:$B$4)for Rent's percentage. - Drag down for others. Format as %.
Result: Rent 66.67%, Groceries 22.22%. Retail workers, apply to daily sales by product. Finance pros, dissect revenue streams. Pro tip: That SUM locks the range for dragging—hello, efficiency.
"Percentages don't lie; they illuminate hidden patterns in your data."
For students grading group projects: Total points 100, your contribution 35. Formula: 35%. Effort quantified.
Excel Percentage Change Formula: Track Growth and Shifts
Sales dipped? Grades soared? The Excel percentage change formula narrates the story. Formula: =(New - Old) / Old, formatted as %. Positive? Increase. Negative? Decline.
Real-World Sales Growth Example
January sales: $5,000 (B2). February: $6,200 (C2). In D2: =(C2-B2)/B2. Result: 24% growth. Drag across months for trends.
Business owners, monitor year-over-year revenue. Students, compare test scores: Midterm 75, Final 92 = =(92-75)/75 = 22.67% jump. For deeper dives on this powerhouse, explore our guide at percent change calculator.
Percentage Increase Excel: Specialized Twist
To calculate percentage increase Excel style, same formula shines for positives. Budget ballooned from $1,000 to $1,300? 30% hike. Formula flags inflation's bite.
Section 4: Absolute References ($) – The Anchor of Reliable Formulas
Drag a formula and watch chaos? Enter absolute references: the $ sign. It freezes cells, banishing drift. Relative: A1. Absolute: $A$1 (both row and column locked). Mixed: $A1 (column locked) or A$1 (row locked).
Why It Matters in Percentages
Back to percentage of total. Without $: Dragging shifts SUM range wrongly. With $B$2:$B$4, total stays pinned. Sales table: Each item's % vs. grand total uses =B2/$B$10. Drag freely—perfection.
- $A$1: Fully absolute. Ideal for fixed totals.
- $A1: Column-fixed. Great for vertical drags.
- A$1: Row-fixed. Horizontal harmony.
Finance pros: Lock tax rates in budgets. Retail: Pin inventory totals. Students: Anchor max scores in grade sheets. Master $, and formulas bow to your will.
Section 5: Troubleshooting Common Percentage Pitfalls in Excel
Excel rebels? #DIV/0! screams division by zero—old value is blank or zero. Fix: Wrap in IFERROR: =IFERROR((C2-B2)/B2, "N/A"). Or IF: =IF(B2=0, "No Change", (C2-B2)/B2).
Top Errors and Fixes
- #DIV/0!: Zero denominator. Use IF(B2<>0, formula, 0).
- Wrong Formatting: Number looks like 0.25? Format as % for 25%.
- Dragging Fails: Miss $ signs. Audit references.
- Circular References: Formula cell in its own range? Trace precedents.
- Negative Percentages: Fine for decreases—just interpret wisely.
Academic grades example: Blank prior score? IFERROR prevents crashes. Retail slump to zero sales? Graceful "N/A" keeps dashboards clean.
Advanced Percentage Hacks for Power Users
Beyond basics: Conditional percentages with SUMIF. Sales > $1,000? =SUMIF(C:C,">1000",B:B)/SUM(B:B). Budget variance: =(Actual-Planned)/Planned.
Dynamic Dashboards
PivotTables auto-sum percentages. Charts visualize growth arcs. Finance twist: NPV with % discounts. Students: Weighted averages—=SUMPRODUCT(weights, scores)/SUM(weights).
Retail pro: % of sales by region. Formula fuels decisions.
Putting It All Together: Your PercentPro Workflow
From foggy spreadsheets to crystal insights, you've got the arsenal: basic divides, total slices, change trackers, anchored $, error-proofing. Next budget meeting? Quote sales surge confidently. Exam crunch? Grades glow. Dive deeper at GetPercentConvert.com for tools that complement your Excel mastery.
Percentages aren't just math—they're momentum. Calculate boldly, decide wisely. Your data awaits.